Graph polar equation $r = 6 cos(\theta)$, issues with plotting on xy-plane
I will be grateful for your help and explanation on how to decipher what authors of the Precalculus book did when plotting the equation from $r,\theta$ -plane into xy-plane. Below I quote 3 parts of their explanations, and attach screen shots of graphs
Example on how to graph the polar equation $$r = 6 cos(θ)$$
Quote part 1:
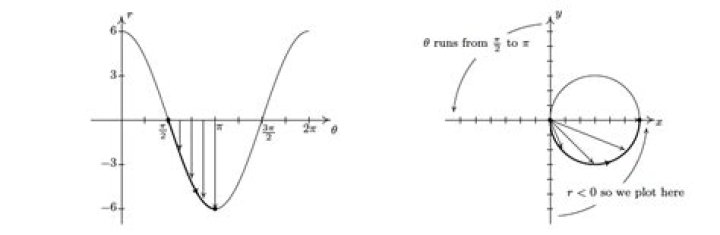
We graph one cycle of $r = 6 cos(θ)$ on the polar plane and use it to help graph the equation on the xy-plane. We see that as $θ$ ranges from $0$ to $π/2$ , $r$ ranges from $6$ to $0$. In the xy-plane, this means that the curve starts 6 units from the origin on the positive x-axis (θ = 0) and gradually returns to the origin by the time the curve reaches the y-axis (θ = π/2 ). The arrows drawn in the figure below are meant to help you visualize this process. In the θr-plane, the arrows are drawn from the θ-axis to the curve r = 6 cos(). In the xy-plane, each of these arrows starts at the origin and is rotated through the corresponding angle , in accordance with how we plot polar coordinates. End of the quote part 1.
Picture attached.
Quote part 2:
Next, we repeat the process as θ ranges from π/2 to π. Here, the r values are all negative. This means that in the xy-plane, instead of graphing in Quadrant II, we graph in Quadrant IV, with all of the angle rotations starting from the negative x-axis. End of the quote part 2.
So, if θ = 3π/4, then r = -3√2 θ = π , then r = -6
In the first part we started at the angle θ = 0 and thus r = 6, which we plotted as x = 6; then rotating counter-clockwise as all values of r become smaller as θ approaches π/2. This is clear to me.
And now I am confused by the second part. It is said that r values are negative, so I don't understand why we plot these values along the positive x-axis and rotate clockwise. How did they come up with this rotation, what is the reason that I fail to understand? The phrase on the picture saying "r < 0 so we plot here" gives a sense that this is obvious, but not to me. Please, help me to understand it.
It seems they are plotting absolute values of r along x-axis, so all x values are positive. But how's this justified mathematically?
Here is also the next, even more confusing, quote: As θ ranges from π to 3π/2, the r values are still negative, which means the graph is traced out in Quadrant I instead of Quadrant III. End of quote.
Interesting. The second part stated that as values of r are negative, we have to plot in QIV; and the third quote says that as values are still negative, we obviously have to plot in QI. I am utterly confused. :) Please, help.
Summarizing a bit:
(1) when the interval is [0, π/2] and r = 6, they start at y = x = 6 and go all the way "up" (counter-clockwise) till angle reaches π/2; it's clear; (2) when the interval is [π/2 , π] and the value of r = -6 at angle π, they most likely start at the angle -π/2, move counter-clockwise "up" till 2π, and surprisingly end at y = x = 6, not x = -6; (3) and then, when even more puzzling thing happens - even though values are still negative and interval is [π, 3π/2], they get back to the interval [0, π/2] in QI; (4) and for the last interval of [3π/2, 2π], they get back to QIV. I genuinely don't get it. It seems there is something very easy-peasy in all this, some very basic notion that I miss.
Thank you very much!
$\endgroup$ 53 Answers
$\begingroup$When $\theta$ is such that $r=6\cos(\theta)$ is positive, as you know, we go to the ray of angle $\theta$ counterclockwise from the positive $x$-axis, and we mark a point distance $r$ from the origin on this ray. This is moving in the "positive" direction along that ray.
When $\theta$ is such that $r=6\cos(\theta)$ is negative, we again find the ray of angle $\theta$ counterclockwise from the positive $x$-axis, but we want to mark a point distance $|r|$ from the origin in the negative direction on that ray. This means instead of moving in the direction the ray points, we move the opposite direction (i.e., the positive direction on the ray of angle $\theta + \pi$). This is why in the second picture, instead of getting points in the second quadrant, they end up in the fourth quadrant.
$\endgroup$ 1 $\begingroup$Your problem seems to be plotting points where $r < 0$. If I've understood your question correctly, two parts of the steps of graphing $r = 6\cos(\theta)$ are confusing:
- When $\theta \in [\pi/2, \pi]$ (so Q2), we have $r<0$. So instead of plotting in Q2 we plot in Q4.
- When $\theta \in [\pi, 3\pi/2]$ (so Q3), we have $r<0$. So instead of plotting in Q3 we plot in Q1.
The general principle behind these two facts is the following: When $r<0$, the point is flipped 180 degrees about the origin. In other words, we're interpreting negative lengths (radii) as lengths with reversed direction.
This makes sense because we do the same thing with positive and negative numbers. Consider the number line. $1,2,3,\cdots$ all are located right from $0$. In order to make sense of $-1, -2, -3, \cdots$ geometrically, we reverse their direction from $0$ by $180$ degrees. So they're written left from $0$.
For example, $(r,\theta) = (2, \pi/3)$ is located at $(1,\sqrt{3})$ in rectangular coordinates. And $(r, \theta) = (-2, \pi/3 )$ is located at $(-1,-\sqrt{3})$ in rectangular coordinates. Draw it out! And notice that $(2, \pi/3)$ is in Q1 and $(-2, \pi/3)$ is located in Q3...
$\endgroup$ 3 $\begingroup$You guys are overthinking this problem because the complete circle can be plotted for $\theta\in[-\pi/2,\pi/2]$ with no negative values of $r$.
$\endgroup$